Back to Full Report Individual Survey Responses
Click on any image to enlarge.
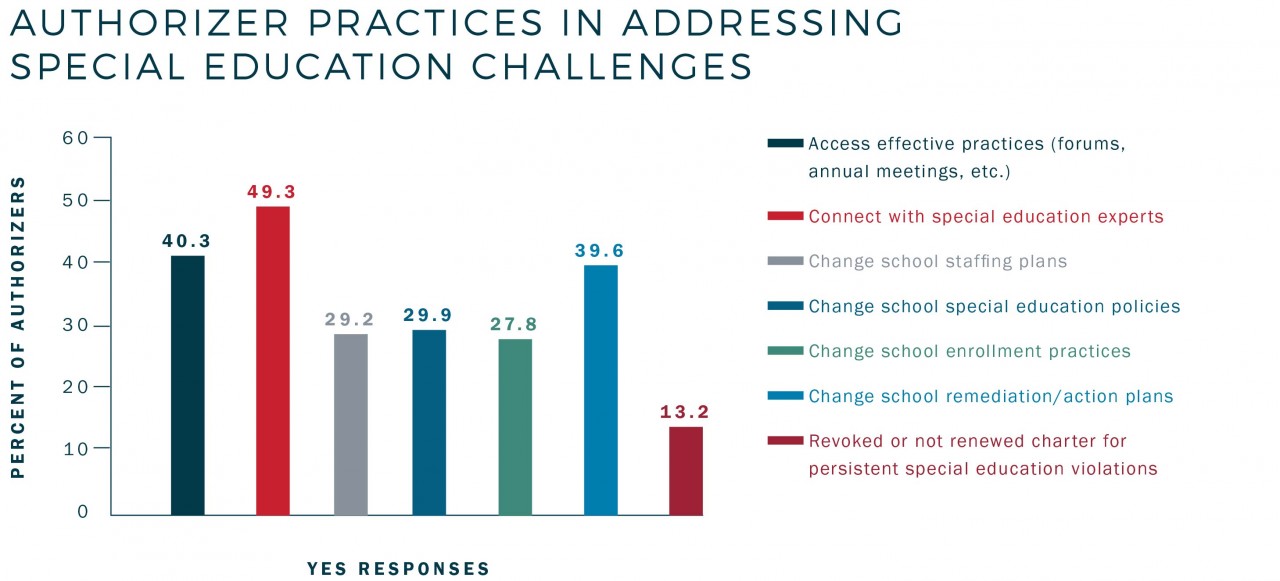
NACSA’s 2015 survey asked authorizers if they use certain special education oversight and accountability practices, either currently, or at least once over the last two years. Authorizer use of these specific practices varied, and oversight practices were the most heavily used.


Analytic models (i.e., analysis of variance and logistic regression) were created to predict authorizer beliefs and practices using the type of authorizer (e.g., school district, higher education institution, independent chartering board) and the number of schools in the authorizer’s portfolio.
As the size of an authorizer’s portfolio increases, authorizers more frequently report using a number of practices. These practices include
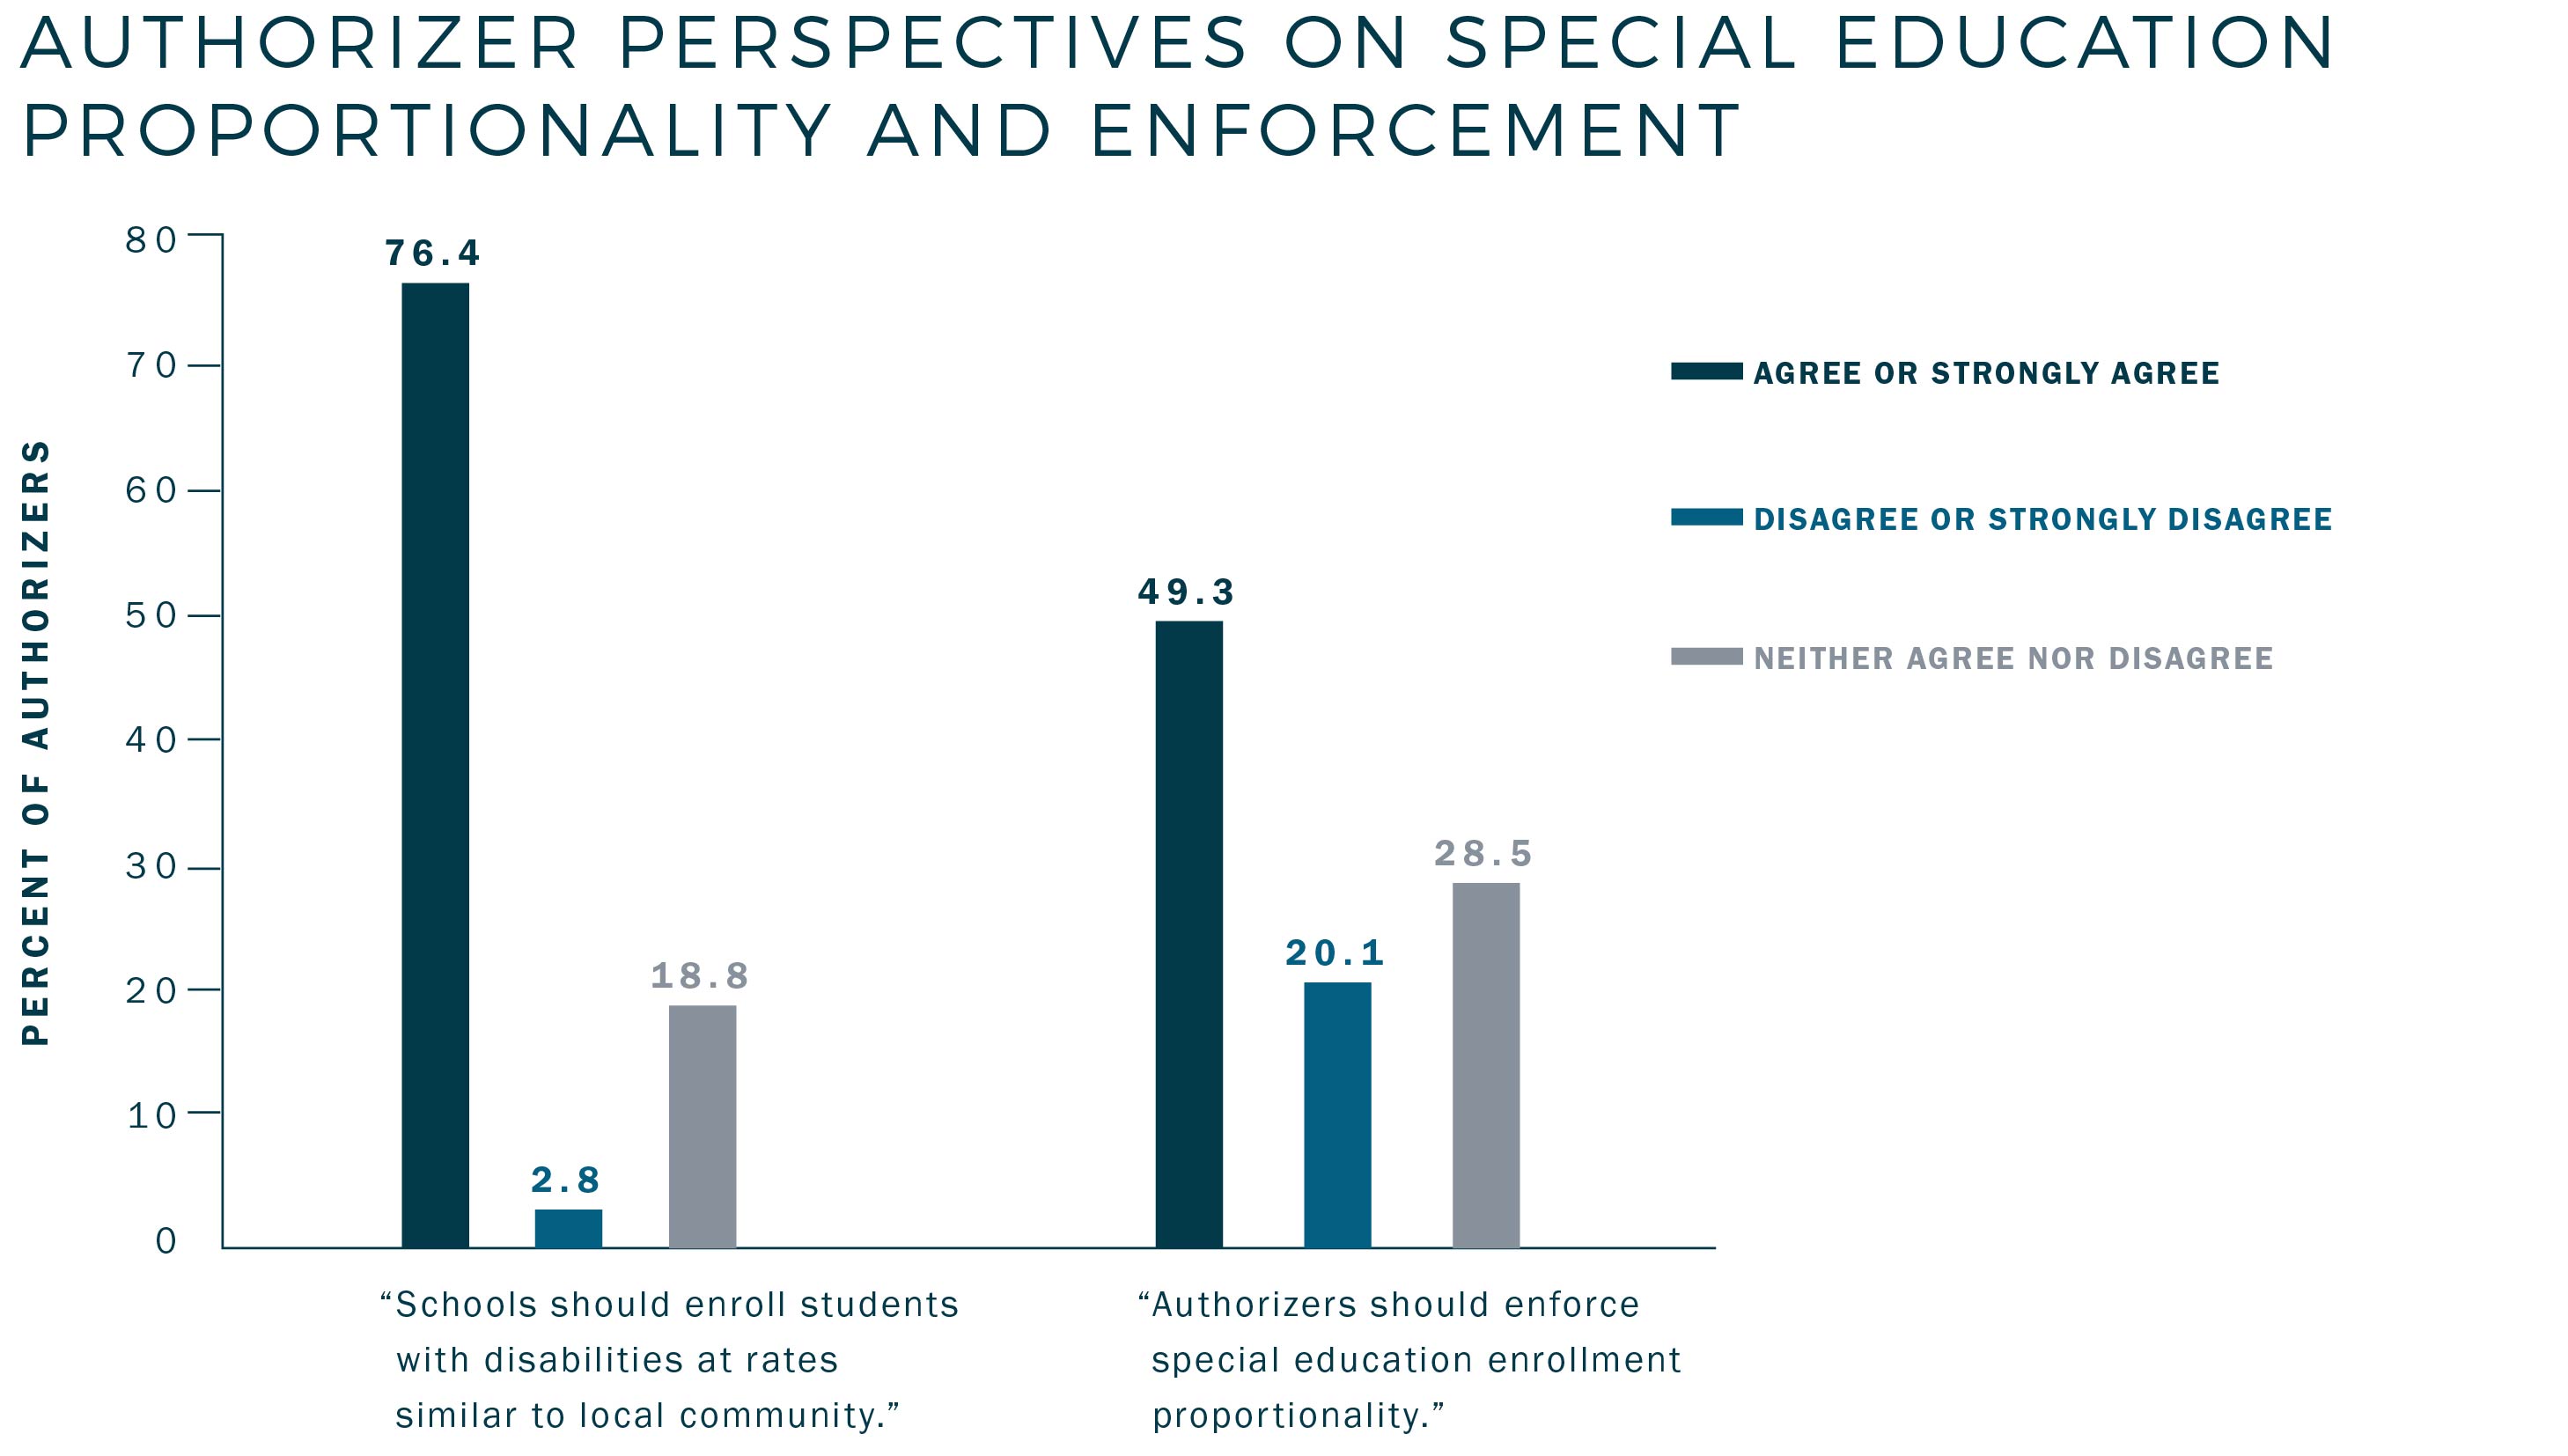
None of the models significantly predicted authorizer perspectives (e.g., perspectives about proportionality, enforcement, autonomy infringement, etc.) and the type of authorizer did not predict authorizer beliefs or practices.
Model findings are available upon request.
From 2008 to 2016, NACSA annually surveyed our nation’s authorizers. Along the way, we have learned about current practices, challenges, strengths, and shortcomings in authorizing.
Survey findings provide an annual measuring stick for those in the field of authorizing, and they help education decision makers, foundations, legislators, and researchers inform their understanding of the field of charter school authorizing.
The 2015 survey asked authorizers to complete 107 questions on a range of topics related to charter school authorizing, as well as perspectives and practices on discipline and special education.
Typically the authorizing organization’s day-to-day decision maker (e.g. charter school director, executive director, superintendent) responds to NACSA’s survey, not authorizer governing board members. Thus, data drawn for this paper represent the perspectives and practices of authorizers as understood and executed by day-to-day decision makers, and are not necessarily an official position of the authorizing institution.
NACSA intentionally seeks a near universal sampling of authorizers with large portfolios (authorizers overseeing 10 or more schools) resulting in an expansive and representative sample of those authorizers, but also in underrepresentation of other authorizers.
The sample of authorizers participating in the survey (N=164) included authorizers from every state with charter schools. They collectively oversaw just over 70 percent of all U.S. charter schools.
Approximately 75 percent of all large authorizers participated in the 2015 survey, and the sample was highly representative of those authorizers (by portfolio size, type, and region). The authorizer to school ratio in this sample was 1 to 28.0 (or 28 schools per authorizer), compared to an approximate national rate of 1 to 6.5 (or 6.5 schools per authorizer).
Relative to all authorizers nationally (irrespective of portfolio size), the sample contained a lower proportion of school district authorizers (61 percent compared to 90 percent nationally), and a slightly higher proportion of higher education, independent chartering board, state board/department of education, and nonprofit authorizers. The sample also contained a lower proportion of authorizers from the western U.S. (35 percent compared to 49 percent nationally) and a higher proportion of authorizers from southern states (28 percent compared to 15 percent nationally).