Applications & Closures
Authorizers collaboratively determine which charter schools open, hold those schools accountable to meeting community needs, and—in rare instances—close schools that are not meeting students’ needs.
We learned that some types of new school applications—like certain types of school models, those connected to large networks, and those with the backing of significant resources—were more likely to be approved than others. Intentional or not, it is important that every applicant is evaluated fairly, and given an equal opportunity to see their vision for schooling come to fruition. This is exactly why it is important to attend to broad trends in applications and closures: to create the ecosystem where community aspirations are honored so that new types of school models are able to be realized and schools that fail students and communities no longer are given that privilege.
*All historical averages are from 2016-2020
FIGURE 01
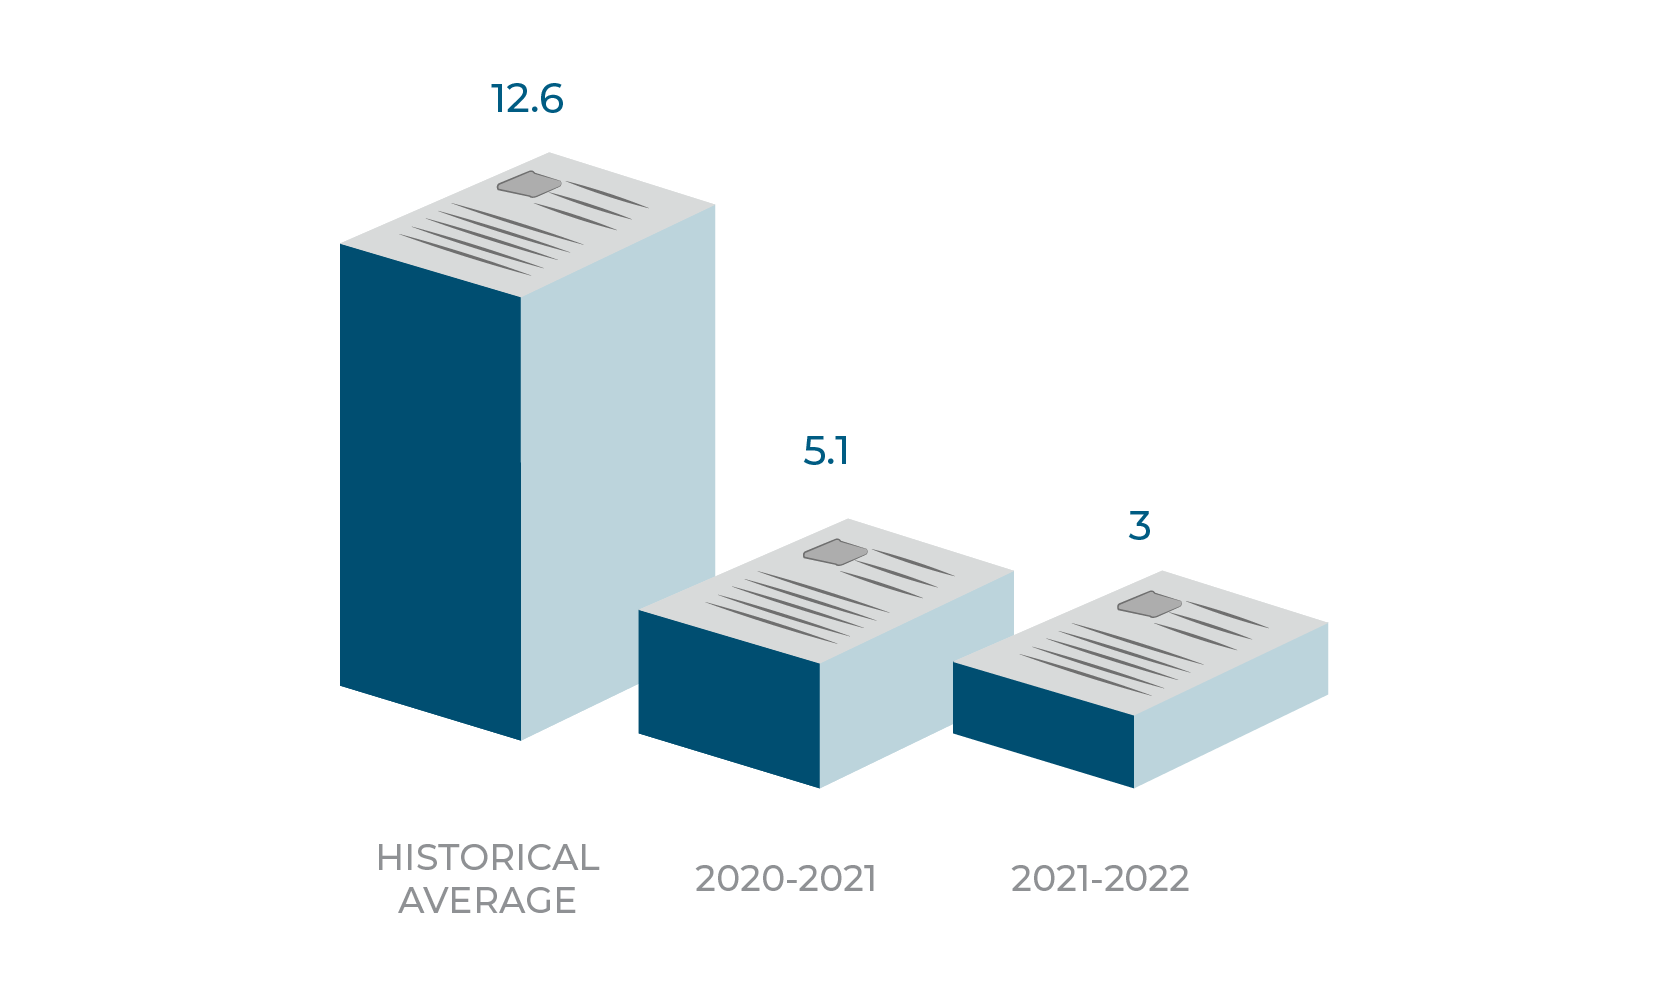
AVERAGE NUMBER OF NEW SCHOOL APPLICATIONS PER AUTHORIZER
The average number of applications authorizers receive continues to decline over the historical average.
FIGURE 02
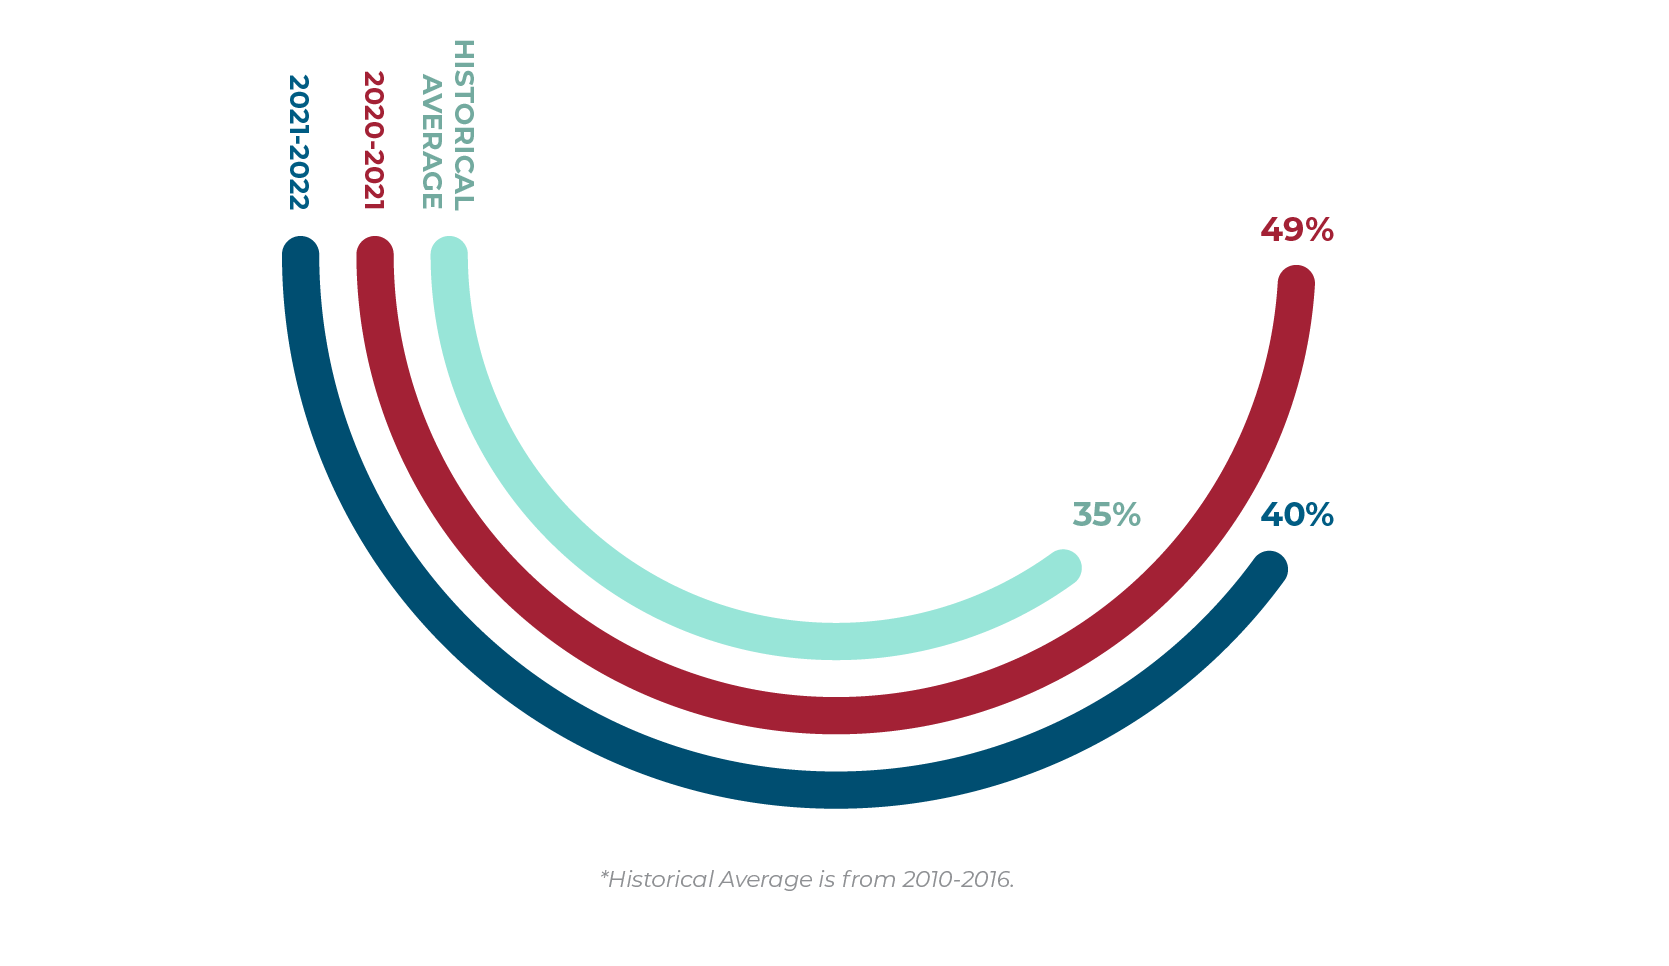
AVERAGE NUMBER OF APPROVALS
Average application approval rates continue to be higher than the historical average.
Despite the number of new school applications being down,
NEW SCHOOL APPROVAL RATES
ARE INCREASING
Based on our conversation with
authorizers, this is for several reasons:
“We are seeing an increase in applications for replication schools and applications for a new type of charter school that targets students in state-designated, low-performing schools.”
– Kathryn Mullen Upton, Vice President for Sponsorship & Dayton Initiatives, Fordham Institute
“Our office is seeing fewer applications and a higher application approval rate. The applications we are seeing are generally higher-quality applications.”
– Tiffanie Pauline, Chief Strategic Officer at Miami-Dade County Public Schools
“We are starting to see new opportunities to operate schools—like microschools and online schooling—within an existing charter.”
– Johanna Medina, Assistant Director of Strategic Development, Arizona State Board for Charter Schools
FIGURE 03
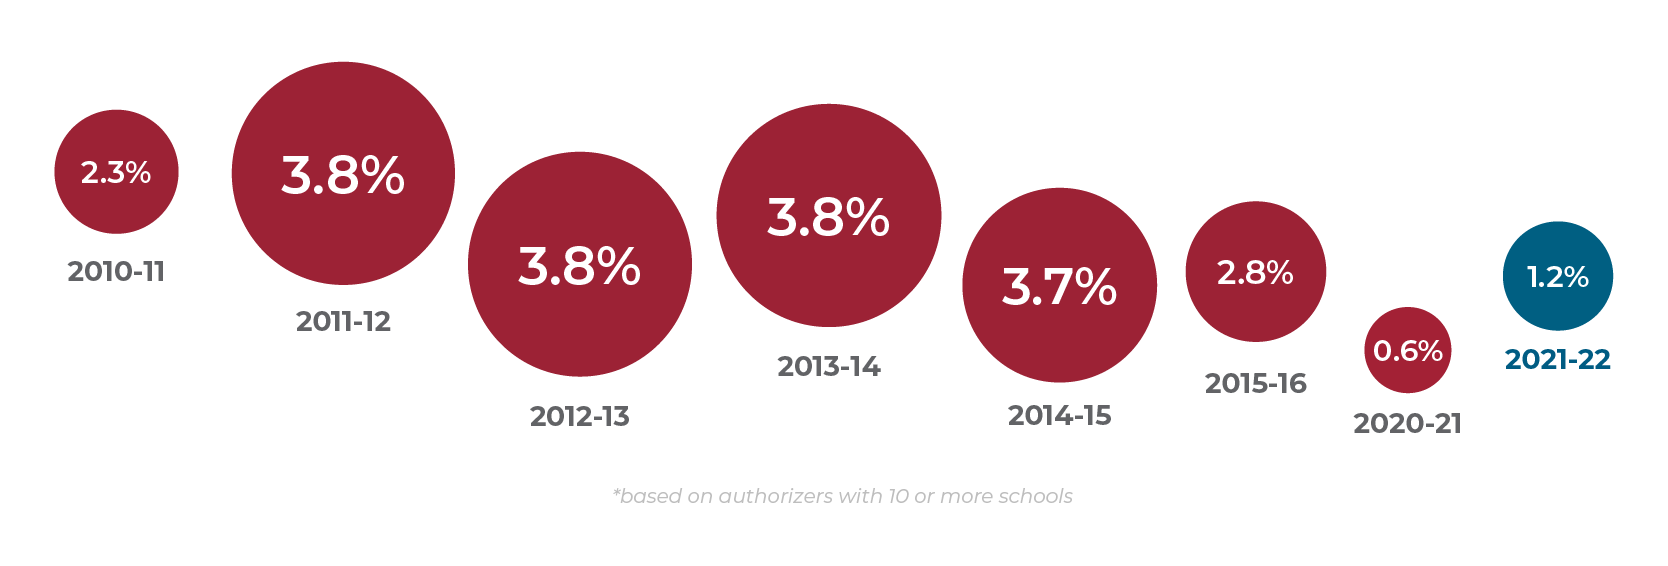
CLOSURE RATE AMONG LARGE AUTHORIZERS*
Over the last several years the school closure rate continues to be low, but is slightly increasing.
*based on authorizers with 10 or more schools
FIGURE 04
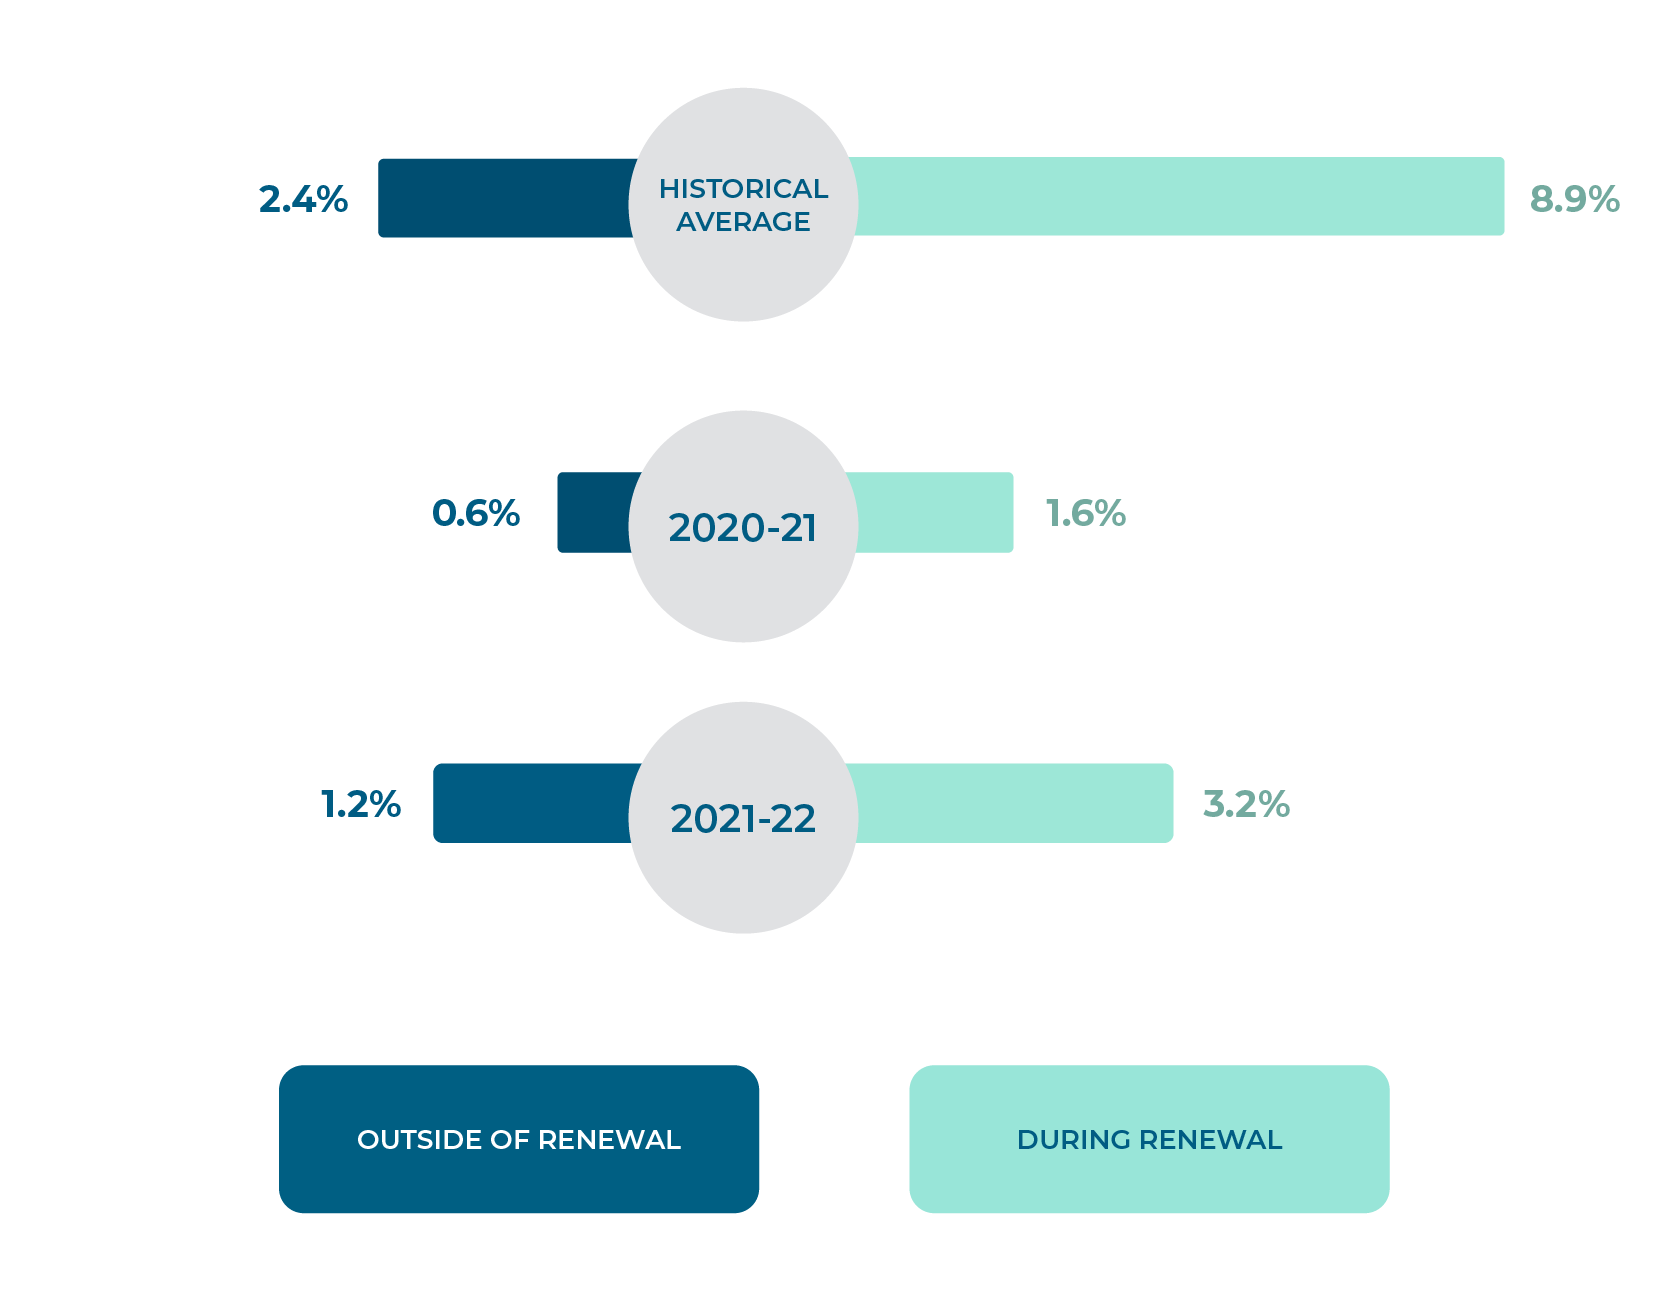
CLOSURE RATE DURING AUTHORIZER LIFE CYCLE
Annual closure rates fell dramatically during and outside of renewal, but are beginning to increase.
*based on authorizers with 10 or more schools
Communities want schools to be accountable for high standards of literacy and numeracy and other goals that measure student preparedness for their chosen futures. And one of the most difficult parts of authorizing is when a school isn’t meeting those expectations. There remains a need for authorizers to close failing schools, and innovative ways of supporting school improvement, without compromising school autonomy.


